Error: Contact form not found.

Indonesia’s advertising ecosystem is expanding steadily, fueled by a young population, rising digital connectivity and a maturing consumer economy. Analytic Edge in partnership with TikTok analysed aggregated findings based on Marketing Mix Modelling (MMM) for 10 FMCG brands in Indonesia. The results were reported at an overall aggregate level. The highlights of the findings are below.
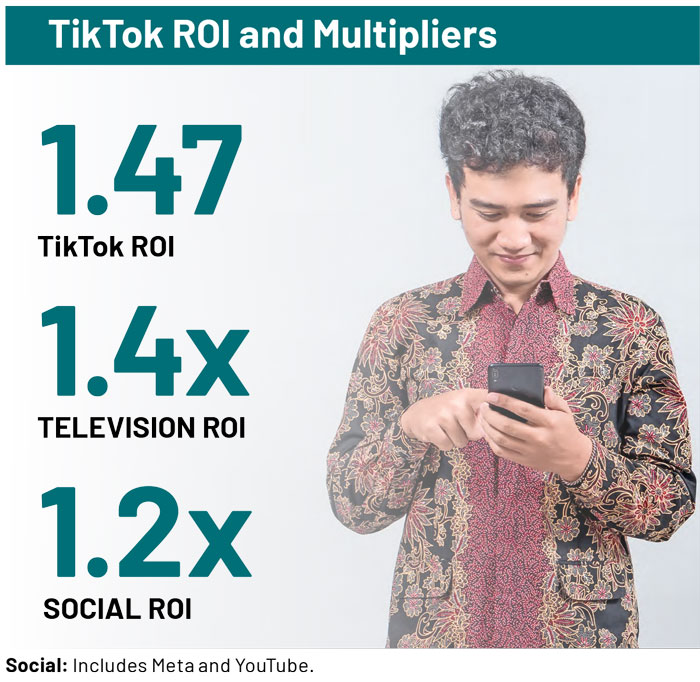
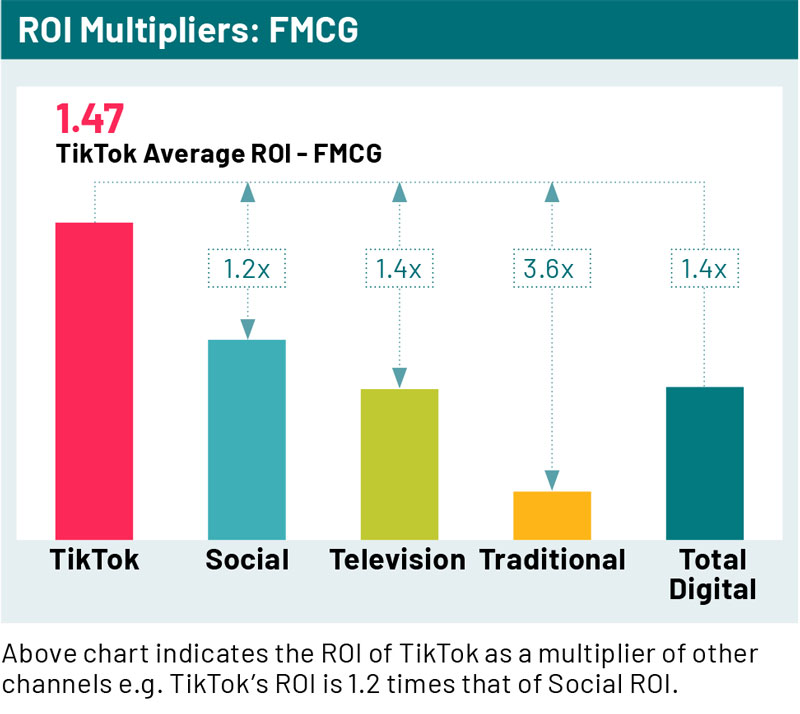
TikTok ROI vs. Other Channels: On ROI at an overall FMCG level, TikTok delivers the highest ROI at 1.47, which is 1.4x times of Television and 1.2x times of Social.
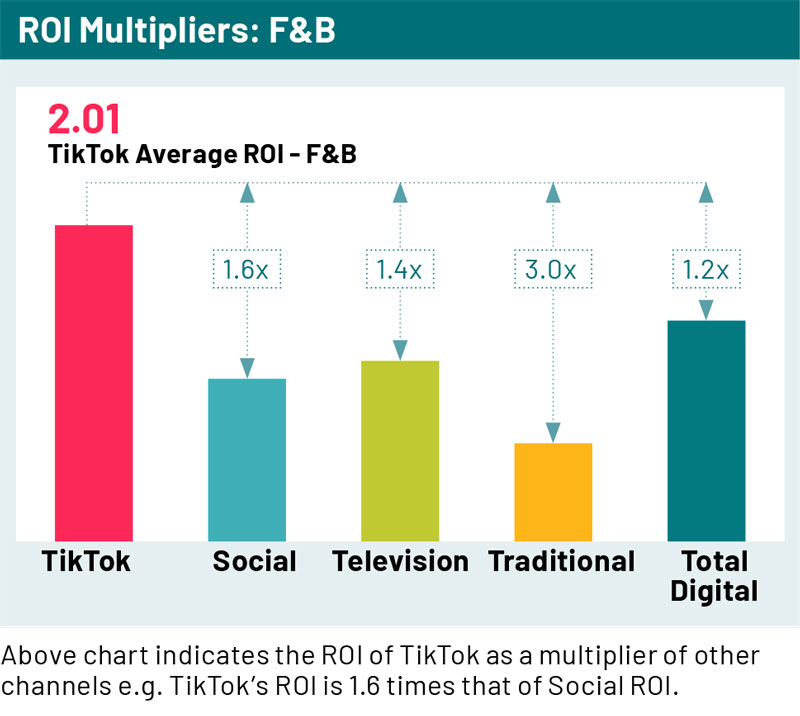
At a subcategory level for F&B, TikTok delivers an ROI of 2.01, far higher than Television (1.4x times) and Social (1.6x times). At the subcategory level for Beauty and Personal Care (BPC), TikTok has a relatively lower ROI but still outperforms Television.
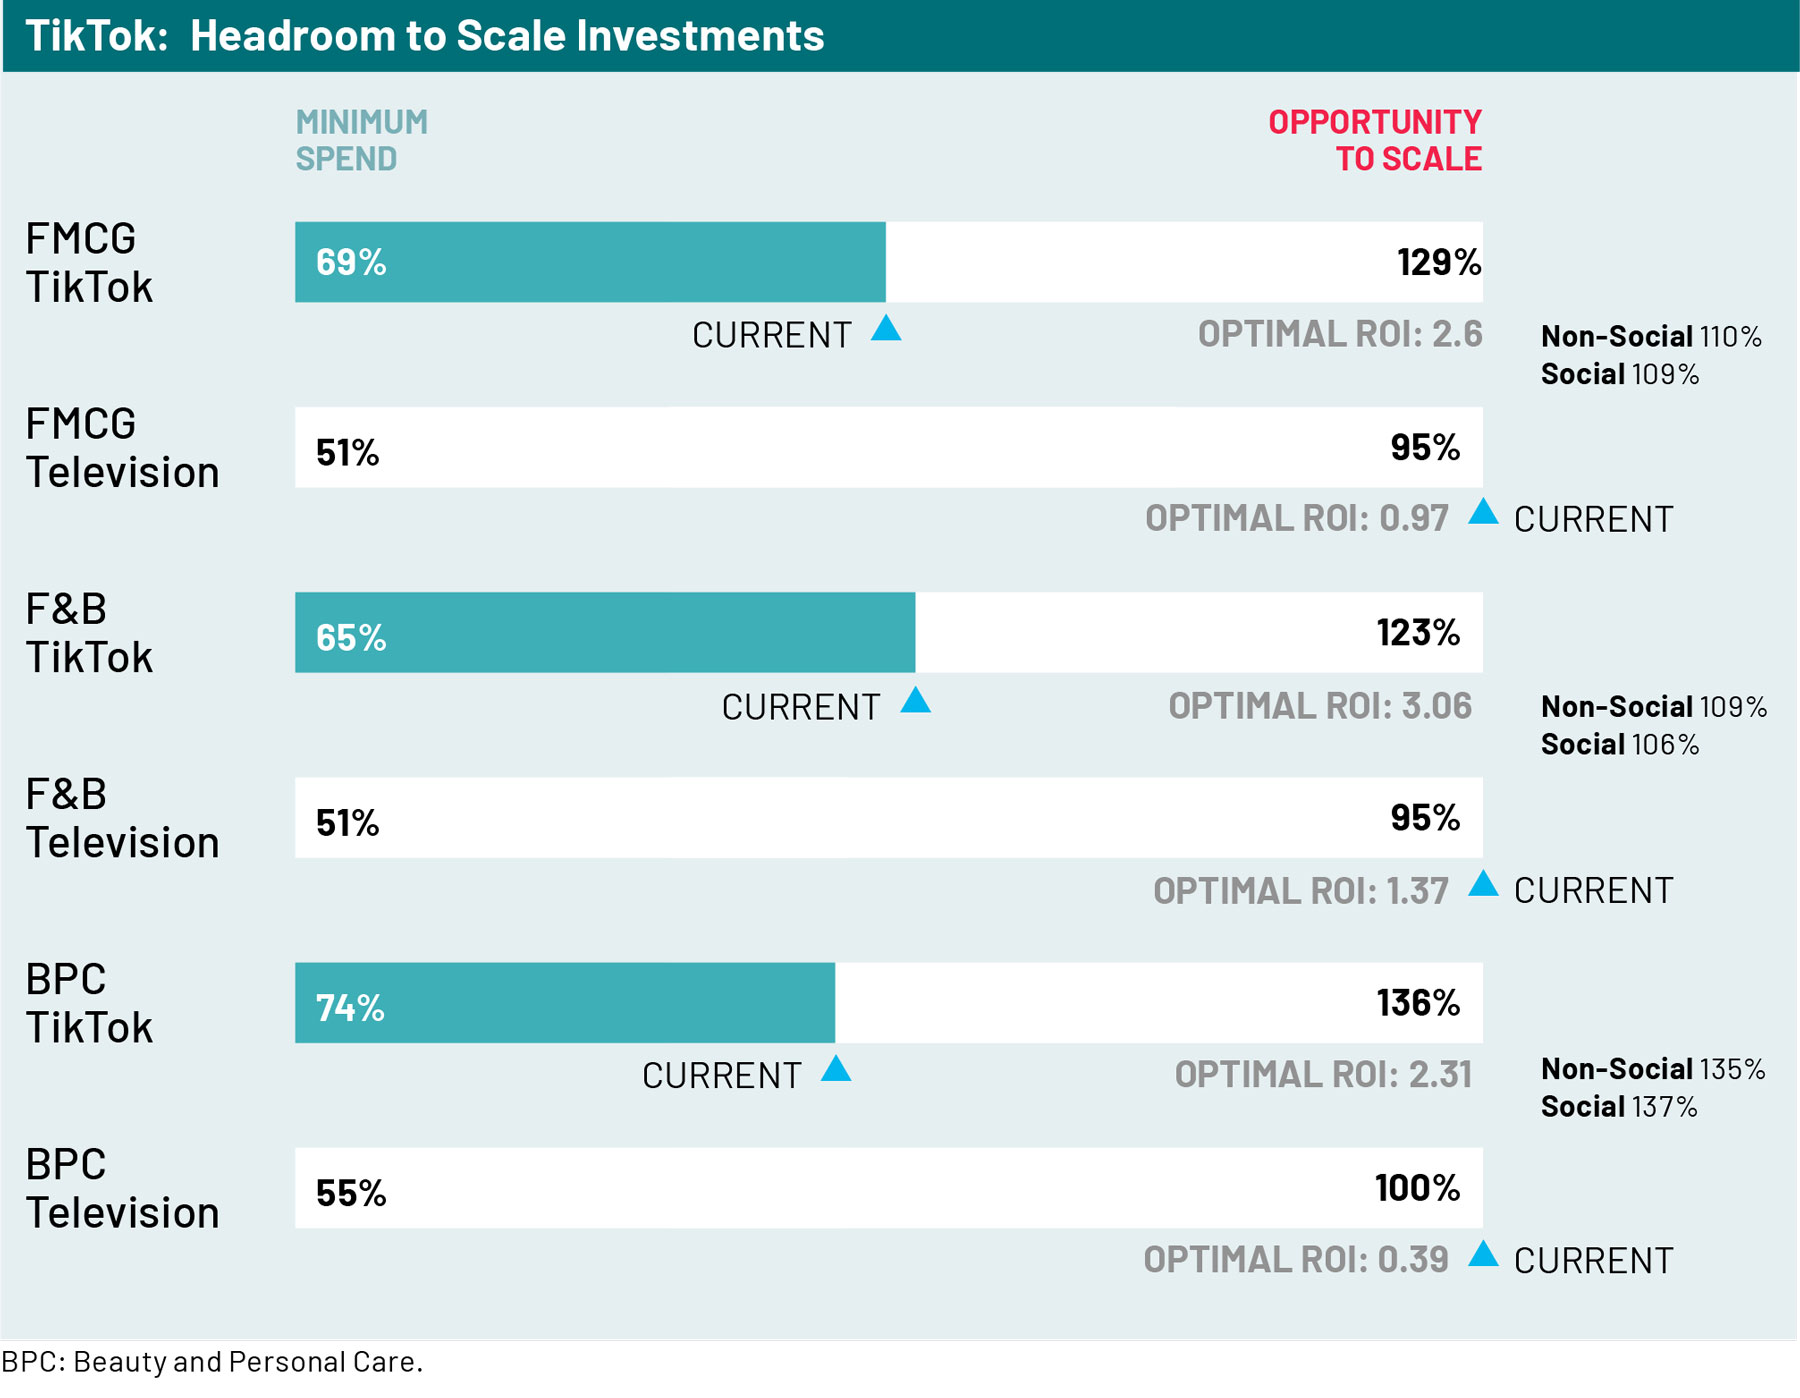
Sufficiency Analysis/ Opportunity to Grow: The analysis reveals substantial headroom for brands to scale TikTok investments while still improving ROI - up to 29% at an overall FMCG level, 23% for F&B, and 36% for Beauty and Personal Care (BPC).
Together, these insights point to a clear and untapped opportunity: reallocating more spend to TikTok can unlock meaningfully higher returns for FMCG brands in Indonesia.
Sufficiency analysis provided guardrail to scale the media spends on TikTok beyond the current level to drive incremental volume and achieve optimal ROI. BPC: Beauty and Personal Care.
1. TikTok Delivers Strong Effectiveness (Incremental Volume Per 1000 Impressions)
For F&B, TikTok stands out as a highly potent growth driver, delivering a minimum of 1.8x the effectiveness of social platforms. This outsized impact highlights TikTok’s ability to convert incremental investment into disproportionately higher incremental revenue, thereby unlocking new layers of growth.
Minimum
1.8x
More Volume per
1000 Impressions
compared to
Social Platforms.
In the Beauty and Personal Care (BPC) category, TikTok performs on par with other platforms. Though the uplift is not as dramatic as in F&B, TikTok’s ability to match the effectiveness of more established social platforms (despite receiving far smaller budgets) signals meaningful potential for future growth as investments scale up.
2. TikTok Leads ROI Performance Across Television, Social, Traditional and Total Digital for FMCG
TikTok consistently delivers stronger ROI than major competing channels for FMCG. At the total FMCG level, TikTok’s ROI of 1.47 is 1.4x the ROI of Television and 1.2x the ROI of Social platforms, making it one of the highest-performing digital platforms.
The advantage is even more pronounced within the F&B category, where TikTok delivers an ROI of 2.01, outperforming all other media channels - including Television and Social - by a wide margin.
Though TikTok’s ROI for Beauty and Personal Care (BPC) is relatively lower, TikTok’s ROI is 1.9x times of Television and 3.2x times of Traditional. In the Beauty and Personal Care (BPC) category, TikTok again leads the digital pack with an ROI that is higher than Social.
However ROI results from the current study present only a part of the full picture. Data from this study is based on purely offline sales. Data from other TikTok studies indicate that including the ROI from TikTok Shops and its other e-comm channels further increases TikTok’s ROI for the overall FMCG categories as well as sub categories. (Source: July 2023 to June 2025-Nielsen MMMs.)
3. TikTok Shows the Greatest Untapped Headroom to Scale Investments to Drive Highest Optimal ROI
The analysis found that TikTok has the greatest headroom to scale up investment compared to all other channel groups.
For the overall FMCG category, brands can increase spends by as much as 29% to optimize the ROI.
For F&B there is opportunity to increase TikTok investments while reducing the spends on Television (where the spends are overleveraged by 5%) to drive incremental sales.
For Beauty and Personal Care (BPC) there is headroom to scale the investments by 38% to drive optimal ROI.
Indonesia’s youthful and highly connected audience is driving rapid digital adoption and fragmenting media consumption patterns.

With strong ROI and effectiveness across FMCG and subcategories of F&B and Beauty and Personal Care (BPC), TikTok consistently outperforms its current share of investments.

Brands remain under-invested in TikTok, and scaling budgets on TikTok offers significant growth opportunities.

Re-evaluating the current media mix and allocating a larger share of media spend to TikTok (from sub-optimal and/ or overinvested channels) can help FMCG brands drive incremental revenue and improve ROI.

Quantifying the ROI of marketing investments is among the top challenges for CMOs.

Marketing Mix Modeling (MMM) is a statistical methodology that measures the ROI of all marketing channels.
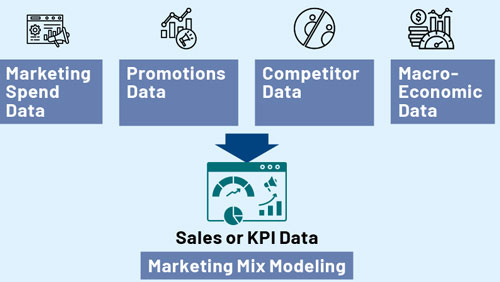
These insights are used for optimizing marketing budget to maximize revenue or profit.
Sufficiency analysis is a mechanism for identifying how your response (incremental revenue per execution) moves along with additional executions. It helps explain the optimal level of execution to achieve the maximum volume response and your saturation point.
In the illustrative example below, the guidance for businesses is to spend between Point B and C. Point B indicates the lowest cut-off point for investment while Point C indicates the investment at which ROI peaks. Ideally, the investment should hover around Point C for the best ‘optimal’ growth. Businesses may invest beyond Point C if they aim for higher growth, or for new brands, where momentum is far more important than efficiency.

Spend Ratio %: % of spends above the current level of spends (100%).
At an overall FMCG level the optimal spending range for TikTok is from 69% to 129% of the current spends levels and there is an opportunity to grow the spends on TikTok by 29% to optimize ROI.
Analytic Edge, a C5i group company, is a leading global provider of AI-powered marketing analytics and insights. The company delivers advanced, real-time analytics solutions that help brands make faster, smarter, and more costeffective marketing and sales decisions.
Through proprietary technology available as SaaS or in-house deployments, Analytic Edge offers always-on analytics capabilities such as marketing mix modelling, revenue growth management, campaign incrementality, and new product launch evaluation. Its intuitive, point-and-click software makes advanced analytics accessible and scalable across teams and markets.
With a client base spanning sectors including e-commerce, mobile apps, gaming, consumer goods, retail, and automotive, Analytic Edge supports global organizations from its offices in Singapore, India, the US, Canada, Mexico, Brazil, the UK, China, Japan, South Korea, the UAE, and Australia.
